Showing posts with label analytics. Show all posts

Sunday, October 22, 2023

Companies with Great Data-driven Return Processes

In my last blog post, I talked about the bad disjointed sales experience at Verizon. In this post, as a counterbalance, I’m giving Verizon props on how they use tracking data to create a great trade-in experience for its customers.

Using UPS tracking data, they keep their customers informed every step of the way.

First, you get a prepaid UPS shipping label from Verizon. They also email your phone's estimated trade-in value and how long you have to send in the old cell phone.

Then this is where they leverage UPS tracking status data to make it a positive customer experience.

Because they already issued the unique UPS tracking number associated with each trade-in, they know if it has been scanned with an item at a UPS drop-off location.

After a week or so, Verizon knows if you still haven’t shipped your phone and emails you a friendly reminder. ✅

Reminder Email

Then once you drop off your phone at UPS, Verizon emails you when the UPS driver has picked up your phone and it’s on the move. That’s reassuring! ✅

Email confirming phone received by UPS

Then a few days later once it reaches Verizon, you get another email confirming receipt. ✅

Email confirming receipt by Verizon

Finally, once they’ve had a chance to inspect the condition of the phone, they send you an email confirming the trade-in value. ✅

Email with trade-in confirmation

Amazon also does something similar.

Once I drop-off a return package, at say a Whole Foods (owned by Amazon), and it is scanned by the store clerk, Amazon sends an email that they got it...usually before I leave the Whole Foods parking lot! ✅

Drop-off Confirmation Email

But they go one step further by refunding you almost immediately a few minutes after the previous email! ✅


Refund Confirmation Email

At that point, while the refund is conditional on how the item actually looks when they receive it, if they lose the product during shipping, you feel you’re not responsible.

And you’ve got more money to spend on Amazon again way sooner :)


In today's data-driven world, there is no excuse why every ecommerce company does not offer this level of service!

##

Tuesday, April 27, 2021

Improving Marketing Attribution

With all the talk of a cookie-less world and the major iOS 14 update from Apple this week that will limit tracking users, I thought I'd share some key things you can do to improve marketing attribution.

Campaign Tracking Parameters

This is an essential setup for campaign tracking and, sadly, most marketers and analysts don't give it the attention it deserves. This leads to "garbage in, garbage out" and leads to less insights. Whether you're using UTM parameters for Google Analytics or setting up campaign tracking codes for Adobe Analytics, the process is similar and it's all in the upfront planning. Ideally, all marketing-driven traffic to your website should have clear tracking parameters based on a well-planned measurement strategy and campaign tracking taxonomy.

What do I mean by that? Let's take UTM parameters for example. The most common UTM parameters are utm_source, utm_medium, utm_campaign, utm_content, utm_term. I recommend creating consistent naming conventions for each UTM parameter so that different teams or agencies who manage different marketing channels (e.g., email, paid search, social) are not doing their own thing.   That will make the web analyst's job really painful. That could mean agreeing that utm_medium represents channel and for paid search this is always "sem" or "cpc".

Also, UTM parameters are CaSe-SeNsItIvE! So "CPC" and "cpc" would be treated as 2 different values. That brings me to the next suggestion.

I have found the most success where a single internal person(s) owns a centralized table of all campaign codes in use for all channels. So let's say your social media agency wants to launch a new campaign, they would submit a new campaign request to this lucky internal individual who would then assign the UTM parameters that meets the campaign's needs.

Lastly, if you are trying to stitch your marketing spend data with your conversion data in web analytics at the channel and campaign level, it is critical that the campaign name in the native ad platform (e.g., Google Ads, Facebook Ads) is the exact same text string as the UTM parameter values or else it will not be 1:1 matching.

This is all part of data plumbing I've previously described.

First-Party Cookies + CRM

Most of the hype and stress among marketers today is around the fate of 3rd-party tracking cookies for advertisers and the Google/Facebook duopoly. But first-party cookies are not going anywhere soon.

When a user visits your site, be sure to drop a first-party tracking cookie that ties to your CRM system. Just so you're not relying on your web analytics tool (e.g., Google Analytics) because that data is aggregated and sometimes sampled. This allows you to capture and analyze user-level data in your CRM system for attribution. The best way to do this is via a unique identifier that is passed between your CRM and web analytics tool at the point of conversion.

By the way, if you have not used the User Explorer report in Google Analytics to analyze an individual user based on GA's ClientID, it's worth checking out! It also tracks the same cookied user across multiple sessions. Combine this data with your CRM data and it helps triangulate the source and the customer journey of your new customer.

User Explorer in Google Analytics

User Survey - Just Ask!

This is the Occam's Razor answer. If you want to know how a new customer arrived at your site, just ask him/her directly! There's a few things I've learned over the years. 

Don't ask this question until after the conversion event to minimize friction in the customer journey. 

Most people like to also make the question optional. However, if you ask the question after the conversion event, I like to make the survey question mandatory.

In my experience, most people actually provide a thoughtful response even though it's mandatory. I see very few cases of people putting gobbledygook just to get pass this question, especially if there was another form field that was important to the user to also submit on the same page (e.g., to get a special offer).

Should you make this question open-ended or a drop down list? While it may be harder to analyze unstructured data, I like to start off with an open-ended text box to see what users actually type. Then in time, once I'm confident of the range of answers, then I'd institute a drop down menu of choices.

Sending a follow-up email is another option, but I often see a much lower completion rate than if you ask them right after they convert. Plus, they may not recall exactly how they discovered you if you ask later.

So, there you have it. 3 great ways to learn what part of your marketing is driving results. Good luck!

##

Friday, February 26, 2021

Why Google Firebase/GA4 is Not Ready for Prime Time

By now, you've undoubtedly seen Google's announcement about the public release of Google Analytics 4, Google's latest iteration that replaces "App+Web". 

Personally, I'm still not a fan of their App+Web property rolled out last year. I agree it's important these days to be able to combine website and mobile app behavior data, but the flexibility that comes from custom Events and the limited standard Event reporting in this new version of Google Analytics still leaves a lot to be desired, compared to Google Analytics "Universal Analytics" version (GA UA).

This past summer, I worked with my client on implement tracking using Google Firebase for a new mobile app, which also led us to setting it up as a Google Analytics "Web+App" property. At the time, that in turn led us to using a different version of Google Analytics than GA UA that some called Google Analytics for Firebase (GA4FB), which is pretty much GA4 now. If all these crazy "Google Analytics" names are confusing to you, you're not alone!

Google says GA4 is the future and will eventually deprecate the current GA UA version. So I was quite excited about learning more about Firebase and GA4FB. Based on my hands-on experience the past few months, Google still has a lot of work to do on GA4 to even get it to parity in terms of standard reporting features and functionality, not to mention ease of use, with GA UA. 

I'm going to share some of my learnings with Firebase and GA4.

Validating Tags for Mobile Apps 

I prefer to validate mobile app tags with actual physical iOS and Android devices, not emulators. I commend Google for creating a way to validate custom Event (and Parameters) tags in real-time on mobile apps within Firebase. In the past, this was very difficult to do, compared to QA'ing website tags with browser extensions. In Firebase, there are 2 ways to go about this.

1. DebugView - From the left panel in Firebase, you'll see DebugView. First, you'll need to follow these directions to put your device into Debug mode and then select your device Debug Device from the drop-down list in upper left. This is a nice precise timelime-driven way to watch events as they fire. You can check parameters on the right. Annoyingly, this was very unstable and unreliable -- often my iOS and Android devices didn't even show up on the Debug Device list. Events also didn't always show up after waiting for 30 minutes. That leads me to the second option.

DebugView Event Timeline


2. StreamView (since renamed to Realtime) - StreamView was a little bit more reliable if you are able to isolate your device by OS and city. In a Staging environment, this wasn't hard to do, especially if you were 1 of the few testers online or tested outside regular business hours (which I often did). Unlike DebugView that had detailed timestamps for events, StreamView does not have such precision and just lists all the events that fired in the past 30 minutes:

StreamView Events List

StreamView would sometimes frustrate me too when events did not show up after 30 minutes, albeit less than my DebugView issues. So that would force me to re-test again and hope that the data showed up.

Also, both methods above do not let you validate data stored in arrays, such as the standard e-commerce parameter Items. This meant one can not QA things like what products users viewed, added to cart, or bought. The only solution was to build some custom queries in Google BigQuery and then some tables in Google Data Studio that mimicked enhanced ecommerce reports in GA UA. 

I also discovered this great YouTube video to help install ADB on Windows for validating Android tags. You can run ADB from a command prompt to get very detailed logs for troubleshooting. From c:\adb folder, run these commands:

adb devices
adb shell setprop debug.firebase.analytics.app com.skechers.android
adb shell setprop log.tag.FA VERBOSE
adb shell setprop log.tag.FA-SVC VERBOSE
adb logcat -v time -s FA FA-SVC

Here's what a log snippet looks like:

name=inbox_view,params=Bundle[{user_id=207067, ga_event_origin(_o)=app, ga_screen_class(_sc)=Shop, ga_screen_id(_si)=8545328432333857419, ga_screen(_sn)=Home]

To stop listening, run: adb shell setprop debug.firebase.analytics.app .none.

Custom Events on Steriods

One of the major benefits of Firebase is the flexibility for custom event tracking. While GA UA has 3 standard parameters for custom events, namely Event Category, Event Action, and Event Label, Firebase lets you name Events and Parameters anything you want. However, this requires more tag planning and work for developers. I like to create a tagging document like this for developers, as well as marketers, so everyone is on the same page:

Firebase Tagging Document

Note there are limits on the number of custom events and parameters you can have in GA4/Firebase. Another reason why it's good to create a data dictionary like the tagging document above so you can try to re-purpose parameter names and minimize the use of custom events by leveraging standard events from Google. For example, here's some standard events.

Data is collected differently so you really have to rethink your data model, especially Parameters for Event tracking. 

Limited Reporting and Data Stuck in GA4/Firebase

The reporting interface takes a little bit of getting used to from GA UA and not all standard GA UA reports are in GA4 yet. For example, enhanced ecommerce reporting took months (back when it was App+Web) to show up. 

There is also a new self-service custom reporting tool called Analysis Hub that reminds me a lot of Tableau that lets you select your own dimensions and metrics to build tables. Note: Analysis hub still won't let you report on arrays!

GA4 Analysis Hub

But would I really need and miss is a way to get data out of Firebase and GA4 to create custom dashboards elsewhere, especially in Google Sheets. I ❤️ Google Analytics add-on in Google Sheets! But unfortunately, Google has not released a GA4 add-on for Google Sheets.

The only option is via BigQuery if you're up for writing SQL. And then you can connect to Google Data Studio or any other environment that works with BigQuery.

At the time of this post, third-party data connectors, such as Supermetrics and Funnel.io, that I spoke to said they were working on a GA4 connector and hope to release a beta product soon. My money is on these guys instead of Google and Google Sheets.

Summary

GA4 feels like a premature product that was released way too early. But while familiarizing oneself with GA4 can be frustrating, it's time to go kicking and screaming into the future with Google. 

##


Saturday, April 11, 2020

Covid-19 Digital Playbook

With shelter-in-place (SIP) and a likely recession due to the Covid-19 coronavirus pandemic, now is the time to double down on digital marketing and sales!

With store closures, many retailers, such as Nike, are reporting Black Friday sales levels and conversion rates! And I've been seeing similar results for my clients.

In fact, in its recent quarterly report, Nike's CEO said it was able to engage its fans via its app and other digital channels while they were quarantined at home, and their free exercise services translated into strong digital sales that helped offset store closures.

Some brands or OEMs who previously had channel conflicts from wholesale/retail partners or their own brick-and-mortar stores suddenly see their direct-to-consumer channel as the only game in town during SIP.

That makes this a critical time to dig into your website and mobile app analytics!

See what part of the site is getting the most traffic, what's selling now that wasn't before, what is the makeup of the customers who are shopping now vs. before, where are users dropping off or hitting UX roadblocks?

For many of my clients, I've seen a spike in mobile web and mobile app traffic especially throughout the day and not just during commute hours. No surprise as people are home due to SIP. Also, historically, lots of office workers shop on their work desktops during the weekdays. It's not uncommon to see high conversions on Mon mornings before lunch as workers tackle their "to do" list after a relaxing weekend. But suddenly they don't have access to those work computers and must go online on their phones. So make sure your site is optimized for mobile, now more than ever!

Re-evaluate all your advertising

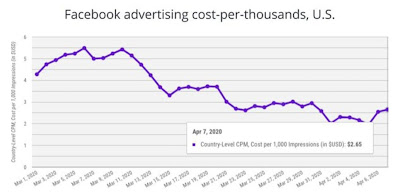
Online ad prices, especially banner, native, and video ads, that run on publisher sites are dropping as supply outstrips demand because advertisers have pulled back on spend because of SIP (e.g., travel industry can't really promote bookings), recession fears, and brand safety concerns (i.e., brands don't want their ads to show next to coronavirus content, especially on news sites). However, if you are less brand sensitive or develop a more targeted blacklisting strategy, you can make out like a bandit for your media buys. For example, Facebook CPMs have fallen to their lowest levels in 2 years.

Facebook CPM Falling (Source: Gupta Media)
It's also a good idea to assess the competitive media landscape. You may discover some competitors have pulled back on their paid advertising in search, display, social, video, or mobile apps. Time for you to grab market or mindshare, likely at lower ad prices as mentioned above. For some of my retail clients where Amazon used to compete with them on search, there's been less competition. Not that Amazon doesn't have the money to bid against them, but more likely because Amazon has more than its hands full now from organic traffic with everyone turning to the online retailer during SIP. (More on that below.) So check your Google Auction Insights reports. On the flip side, depending on your industry, you might see quite the opposite competitive pressure and everyone is getting more aggressive to capture as much demand as possible right now. Think about the fiercely competitive online video conferencing space right now where you have Zoom, GoToMeeting, Microsoft Teams, and Webex duking it out.

I expect performance media campaigns to see less budget cuts than branding campaigns.

Also, make sure your ad messaging is on target and appropriate for these times. For example, yesterday morning I heard a local radio ad that asked "Taking your kids to school? Listen to us in the car." Really? Schools have been closed for a month during SIP! Someone at the station clearly sleeping behind the wheel.

Take stock of and promote your most relevant product and service features during these times.

By now, as a consumer, every company has probably sent you an email and driving you to their Covid-19 landing pages to explain how they are reacting to the pandemic and SIP. And most importantly, what special services they are offering during these uncertain times.

So, as a brand, what are you going to promote?

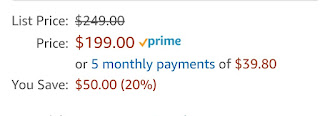
If you have interest-free payment plans or "layaway" plans like Afterpay, it's time to promote that. Amazon features it prominently on higher ticket price items (see below). Some auto companies have rolled out 0% interest, 72-month auto loans even!

Amazon's interest-free payment plan

Right now consumers are very concerned about supporting small businesses who risk going under. For smaller businesses who are reaching out to their community for help, now's a good time to setup and promote online gift cards. Square, which is quite popular with small businesses, has even created a Give & Get Local site to make it easy for local merchants to promote their e-gift cards to consumers. I've seen when merchants promote this in email campaigns, consumers are buying them to keep their favorite businesses afloat, hoping to patronize them later when we get through this. Facebook is also offering small businesses grants.

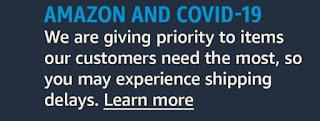
Offer curbside pickup following social distancing best practices? Promote that. Are your shipping and delivery times still unaffected? If you compete with Amazon, you may have an advantage now against the Prime shipping program as Amazon is swamped with traffic and orders, forcing them to prioritize some items over others. I don't blame them. I was about to buy an item that was eligible for Prime shipping. But at checkout, it said it won't ship for 1-2 months! That's crazy. #abandoncart

Amazon delayed shipping warning
Sports retailer Sports Basement has been sending out emails that promote online events to help customers stay fit, such as live workouts with a trainer via video conference and healthy recipes to try at home (side note: there has been a spike in baking and home cooking with SIP). And of course, discounts for shopping online! Similarly, REI has 6 Ways to Mix Up Your At-Home Workday. Both are great examples of brands staying true to their brand positioning while producing relevant, engaging content for their customers.

Sports Basement workout tip
Also, make sure you are monitoring online chatter using social media tools. How are consumers reacting to your company's response? For many brands, they are dealing with significant customer service complains on social media, online chats on their sites, and of course their call centers. But also use this data to see what's trending? How do you weave your brand into the conversation? The key is to be authentic, empathetic, and not too salesy.

Get the word out!

When you've identified relevant content to share with the community, it's time to put the CRM team and tools to work! Leverage that email database you got! For small businesses using Square, Square is offering Square Marketing, its basic CRM program I previously reviewed, for free right now. Yelp is also offering some of its premium marketing services for free for small businesses. Take advantage of these tools! Most are very easy to use without a huge learning curve.

Of course, take it to social media channels. Remember when just a few weeks ago, the government and consumer privacy advocates wanted to take down Facebook and Big Tech? Now, consumers are spending more time than ever on Facebook and almost every single social network has seen engagement shoot through the roof! When you do post, do some #hashtag research to maximize visibility.

And this goes without saying, but make sure your website can handle increased traffic, especially if you're a retailer and your stores are closed. You might also consider a code freeze like most online retailers normally do Nov-Dec. Don't risk rocking the boat when it's the only sales channel you got right now!

Lock-in long-term behavior changes

Lastly, all this time at home and SIP has forced consumers and businesses to change their behavior, largely favoring online activity, and you should take advantage of making these behaviors long term habits. Just to name a few benefactors -- online video conferencing, online banking/mobile app banking, online grocery delivery, esports, virtual medical professional services like SteadyMD or Talkspace, not to mention multi-channel retailers who have struggled to get in-store shoppers to go online or use their mobile app. Post-SIP, all these industries will benefit from an injection of new users; the key will be to keep as many as they can as paying customers for years to come.

My Covid-19 Digital Playbook:
  1. Dig into your web + app analytics data for insights
  2. Re-evaluate your media buys and messaging
  3. Develop relevant content for Covid-19 behaviors due to SIP and be useful to consumers
  4. Be active on social media and email channels
  5. Be prepared for how to exploit long-term behavior changes after we get through this to capitalize on your short-term wins
Now I only wish there was a digital solution for haircuts because I need one badly! =( And I don't just mean an AR filter for my video calls or socialpost!

Stay safe and sane out there...

## 

Wednesday, October 3, 2018

6 Questions to Determine if You're a Data-Driven Marketing Company


Competitive companies know they must be more data-driven today. That in turn requires a combination of technology and talent.

Data management is not easy. In a recent survey, 47% of marketers said it was difficult.

Data Management is Difficult
Here are 6 questions to ask yourself to see if your company is a data-driven marketing company:

1. Is your data centralized?

I often find data scattered across an organization with any one group only having visibility into part of the customer journey. Centralizing data would also help break down data silos across systems and departments. Sometimes I find different answers from different sources, presumably answering the same question. For example, why is online sales from our CRM system different from the web analytics? There's bound to be some discrepancies due to tracking methodology. But you do need to agree on one source of truth for reporting purposes.

2. How's your data hygiene?

It's hard enough centralizing all your data and stringing it together with primary keys and join functions. But you also need to spend time on data hygiene as an ongoing maintenance plan. Data integrity is key to combatting what I call "garbage in, garbage out."  You should be routinely looking for things, such as missing data, weird outliers, and duplicate records. Ultimately, you need to trust your data before you can rely on it.

3. Are you democratizing your data?

Are you empowering the right people with the right data in a timely manner so they can make informed decisions? For example, are social media campaign results accessible by not just the marketing team, but also the PR team? Are the marketing folks who are responsible for lead gen able to access sales data from the sales team to know the quality and close rates of their leads? And vice versa.

Often times this leads to the development of a shared online dashboard, such as Tableau, that let's users drill down to the data and analysis they need. But make no mistake about gathering business requirements first to know what internal stakeholders really need in order to design the right dashboards for specific users so they are not all swimming in a sea of data! 

4. Can you tell stories with your data?

Since we were babies, we have loved bedtime stories. Guess what? Executives and managers still love stories! Can you translate data into actionable insights? In my experience, I see lots of reports that's just numbers in Excel or on slides. In a recent study, many marketers find this to be one of their biggest challenges actually.

Importance of Storytelling with Data
Here's an example of translating data into insights. Let's say you ran an A/B subject line test for an email campaign. A good analyst will report out the open rate for both versions, calculate the lift % and significance level, and determine the winner. A better analyst will have a hypothesis on why the one subject line might have won and propose the next A/B test to run and why. Give something for the copywriter/marketer to work with.

5. Do you have top down support from senior management?

This is critical to know if the culture at the company truly supports data-driven decision making. Are executives willing to invest in the tools, resources, and personnel to enable data to flow freely across the organization? Are executive ready to rely on data to make big business decisions vs. their gut/experience? Or is it lip service?

6. Do you have strong partnerships between Marketing, IT, and Analytics/BI teams?

If you don't have top down support, this one will be even harder! At the minimum, this triumvirate is required to connect the disparate data sources...or what I refer to as data plumbing. To be successful, communication and trust across these teams is critical.


If you answered yes to all of the above, CONGRATULATIONS! You're a data-driven company well positioned for the 21st century.

##

Thursday, September 6, 2018

Marketing Analytics: Why I Obsess Over Rates

I don't mean interest rates on my savings account, which is still paltry BTW. =)

I see marketing analytics reports all the time from clients that focus on absolute numbers like visits, conversions, clicks, opens. These are good to know, but I find these metrics meaningless in a vacuum. Is 10,000 clicks in a month good? It depends...

Instead I like to focus on relative metrics like calculated rates and ratios.

Rates are great to track metrics over time, to offer context, and to compare to industry benchmarks because rates are normalized. This means you can compare rates over different time periods to see if something is wrong or if something is doing surprisingly well all of a sudden. This also allows a smaller company to compare themselves to a larger company, generally speaking.

Let's look at how to use rates in common digital marketing reports to reflect the most insights.

Website Analytics

Example 1: Conversion Rates. Every website needs to have a primary goal or "conversion" event that is clearly and cleanly tagged on the website. That can be an e-commerce transaction or lead gen form completion. Everyone always then tracks the number of "conversions" each week or month in absolute terms.

Most, but not all, clients look at conversion rates. Yes! But there are multiple ways to define "conversion rate." Some define it as conversions / site visits. That's not bad and Google Analytics offers this in their standard reporting. The problem with just looking at this "start to finish" conversion rate is it does not help you identify where the leak in the conversion funnel is. Furthermore, this is often a very low number like 0.05% so it's really hard for senior management to fully understand such a metric.

What every marketer should do is also break down the customer journey into smaller bite-size paths. In the illustration below for an online lead gen site, by simply breaking the customer journey in half to calculate a Consideration Rate and a Completion Rate, you now have more actionable insights.

Purchase Funnel Rates
This helps identify where you have leakage in the funnel and how to address it. For example, if form completion rate is low, maybe your form is too long or confusing. Also, this completion rate should be easier to digest because it usually ranges between 5%-50%. So if you have a completion rate of 10%, you can ask yourself does that feel low when 9 out of 10 people bailed. Much easier to comprehend than the 0.05% conversion rate example above.

This form completion rate is also ideal for industry benchmarking because the "scope" of your metric is just a form and form completions. If you used the 0.05% conversion rate, the scope of that metric is all visits to your site for whatever reason and all the pages on your site. So it's really hard to compare apples to apples on such a broad conversion rate. Take retailers who live and die by shopping cart abandonment rate, which is the reverse of completion rate. Industry-wide cart abandonment rates are relatively easy to find and benchmark to your own cart abandonment rates.

Before moving on from this example, I wanted to mention the Consideration Rate. This is worth monitoring because if it's low, it means users are not showing any interest in your product. So you have to ask yourself questions like "Is our CTA not prominent enough?" or "Are people really not interested in our product offering?" The former can be a user experience issue, while the latter is a product or product marketing issue.

Example 2: % of Totals. This is a very simple ratio and calculation, great for providing a frame of reference. Take the classic Top Pages by page views report.

% of Total Pageviews Example

Most clients will quickly grab this data from their web analytics tool that shows pageviews in rank order, but sometimes discard the % that is often in the dashboard. I like to also provide the third column that is % of Total Pageviews because then you can better appreciate how popular a page is relative to other pages on your site. It's usually harder for senior executives to understand if 72K pageviews for the Product Overview page is low or high, but 25% of all pageviews is easy to grasp and to conclude it's very high for one page to garner.

I calculate this % of Total for a lot of site metrics beyond page views, such as % of Total Video Plays and % of Total Downloads. Again, the goal is to show if activity is concentrated among a handful of content or assets or more fragmented and distributed across all of them. If it's more concentrated, figure out what makes them so popular and do more of that!

Example 3. CTR. Clickthrough rates (CTR) are often associated with paid media ads and email links. But I like to calculate CTR for website analysis when analyzing CTA button clicks or on-page analysis to see what users chose to click on when presented with a host of options. Here's an example from a directory search results page. CTR is calculated for each link based on link click / page views. This is also a more visually appealing way to show these stats than a standard table. I also like to develop a similar slide for CTRs on the global navigation menu. One critical tip: usually you must setup custom click tags to calculate the CTRs I've discussed.

CTR Website Example
In terms of benchmarking, CTRs are great because you can compare pre- and post-launch CTRs if you redesign your website.

Email Performance

Most clients already focus on open rates and CTR. 👍 But I still see reports like this occasionally:

Email Report Without Open Rate Example
For most marketers, the opportunity here is for benchmarking rates. Epsilon publishes a great quarterly report that is free that is full of email benchmarks by industry and by types of emails (e.g., editorial/ newsletter, marketing, service)!

Last comment on email metrics. Don't forget to look at CTOR (Click-to-open rate), which is clicks / opens. CTOR is different than CTR, which is clicks / delivered. Monitoring and benchmarking CTOR can help you address issues with the content or CTA within the email body and usually rules out an issue related to the subject line.

Social Media Campaigns

Engagement Rate Example. For social media campaigns, paid or organic, one of the most popular primary KPIs is engagement rate. Most marketers define engagement rate (a.k.a. interaction rate) as (reactions + comments + shares) / posts. But if I'm a marketer, what constitutes a good engagement rate? A social media analytics tool, such as Quintly, is great for answering this question. It not only allows you to compare yourself to other competitors, but it has also created industry averages. In the example below, let's say I'm BMW USA. I can compare not only my Interaction Rate to direct competitors Audi and Mercedes, but Quintly also shows the average Interaction Rate for the Top 10 US Auto manufacturers. Quintly has other useful social media benchmarking tips on a recent blog post so I won't go into any more details here.

Quintly Interaction Rate Example

Paid Media Campaigns

Example 1: SEM & Display. Almost all media managers report out on CTR, CPC, and CPM for paid search and display campaigns. Yay! The suggestion I have here is be sure you ask your media partner or publisher who you are working with for industry benchmarks on these common media metrics. For example, your Google rep will often put together a quarterly report showing you your SEM spend, CTR, etc., relative to other advertisers in your category or industry (see example below). They will usually slice this by brand vs. non-brand and desktop vs. mobile. One caveat with these Google benchmarking reports. It will almost always show you are under-spending and under-performing because you are being compared to a Category Leader Average not the entire Category Average. Google obviously has an incentive to motivate you to spend more 😉

Google SEM Benchmark Example

Similarly, for display campaigns, find out what's the industry CTR from your vendor. If you're running rich media unit ads, find out what's a good engagement rate for user interaction with your unit in your industry.

Most digital advertisers also look at efficiency using Cost Per Acquisition (a.k.a., Cost per Conversion or Cost Per Lead). I also like to look at Click-to-Conversion rates.

Example 2: Video. For video ads, you need to look beyond video starts or plays. For sure, look at video completion rates. Or even better, look at milestones like quartiles. Below is an example of a Video Completion Rate Funnel with quartile milestones. This helps you identify where people are dropping off. For example, in pharmaceutical videos, users often drop off when the super long Important Safety Information (ISI) begins to play so I often place a milestone marker at the ISI start.

Video Completion Rate Funnel Example

For benchmarking purposes, ask your media partner or publisher for average completion rates for your industry. For example, they should be able to tell you the average completion rate for a :30s video is 30% in the financial services industry.

Summary

So there you have it. Now you know why and how I am obsessed about Rates and Ratios for my clients' marketing analytics reporting. All of the above are very simple concepts. You just need to spend a little bit of extra time in developing your measurement and tagging strategy and also on reporting. But in return, you become awesome at storytelling with data!

##

Disclosure: I am a strategic advisor to Quintly.

Monday, March 19, 2018

6 Offline-to-Online Marketing Integration Best Practices

Despite all the doom and gloom in the retail sector, such as the planned liquidation of Toys R Us, some retailers are doing some great things in terms of marketing. While Bed Bath and Beyond (BBBY)'s stock price has fallen by over 33% the past year, its latest in-home mailer offers some great examples of O2O integration across its digital and offline marketing programs.

When I first received their Spring 2018 mailer, it is clear they are migrating to more of a lifestyle brand catalog, like Pottery Barn. It's thicker (84 pages!) and on higher quality paper stock. In the past, it was a few pages and the paper was junk mail-like paper quality.

Spring 2018 in-home catalog


1. MOBILE APP PROMOTION

Open up the first page and BBBY immediately and prominently promotes its mobile app, telling you how you can easily shop the catalog via mobile by just scanning the catalog's front cover with the app's AR scanner.
Mobile app promotion


2. SOCIAL MEDIA PROFILE PROMOTION

Also on the same page, since they're talking mobile, BBBY promotes its Instagram profile. But I'm surprised they did not also promote its Pinterest page, because home decor is so popular!

Cross promotion of BBBY Instragram acount


3. KEYWORD SEARCH CALLS TO ACTION

One of my favorite tactics is their suggestion to enter specific keywords into its website's search bar to see all the same products laid out in its catalog:

Shop the room: Search keyword cues in catalog

Close-up example of keyword: airy living room

If you type "airy living room" on its site, you see the below landing page, which is a great hand-off from the catalog. This is so much easier for consumers than trying to recall a long website URL path to manually enter in a web browser.

My only suggestion for improvement is to make the room photo interactive so if I click on an item I like, it has an anchor link on a hotspot to take me directly to the specific product description rather than scroll through the extremely long landing page with all the products listed below the main photo.

Landing page if you search for "airy living room" on bedbathandbeyond.com
From an analytics perspective, the keyword CTA is great because from your web analytics tools, such as Adobe Analytics that BBBY uses, you can see the exact search volume for each keyword entered to truly gauge how popular this tactic is! Because let's face it, no one in his/her right mind will think of entering "airy living room" without some kind of prompt =)

4. VANITY URLS & TRACKING

Throughout the catalog, BBBY has CTAs to go online using vanity URLs. Near the end, it even has one page that promotes many of its offerings online.

Vanity URLs galore from catalog page!
All these URLs resolve and redirect to longer URLs. For example, bedbathandbeyond.com/yourmove redirects to https://www.bedbathandbeyond.com/store/static/movers.

bedbathandbeyond.com/creditcard-catalog redirects to BBBY's credit card partner Comenity's website: https://c.comenity.net/bedbathandbeyond/pub/apply/Apply.xhtml?cmp=460_print_apply_catalog_201701_001

What is noteworthy here is that Comenity has assigned a unique campaign tracking code to this URL. This gets passed to its Adobe Analytics as a campaign parameter to easily and surgically track the session of a user that came from this ad placement in BBBY's catalog. Perfect! Unfortunately, BBBY does not have these detailed campaign tracking codes in the vanity URLs that drive to its own website for some reason, so that's a big analytics miss.

5. COUPONS TO TRACK IN-STORE PURCHASE

Typical 20% off coupon
As many of you know, BBBY is extremely generous with its distribution of 20% off coupons. This direct mail catalog was no exception. While the retailer thought about weaning itself off of such promotions a few years ago, it hasn't. But I'm glad to see that if you're going to offer a coupon, track the heck out of it! Here's what they are doing that more retailers need to do. BBBY's direct mail coupons have unique bar codes on them for tracking purposes. These are unique based on customers in its CRM system. When a user redeems the coupon in a physical store (or online), this tracking code is captured and BBBY knows you actually bought something in store.

But many retailers stop short of doing something useful with this insight. BBBY sends a personalized email (see below) a few days later to (1) thank you for your recent in-store purchase and (2) ask you to rate the purchase to help populate its user reviews on its website. This is a great example of tying your print, web, email, and CRM marketing campaigns together with a bow!!! All this is done without me ever realizing they matched, on the back-end, my email address from an online order I made once a long time ago to my CRM profile. I didn't have to give my name or email to the cashier in the store. It was all tied to the physical coupon seamlessly!

Thank you email tied to recent purchase
(BTW, if you didn't know, these BBBY coupons never really expire despite the expiration date printed on them.)

6. ACQUISITION INTEGRATION

Last year, BBBY bought Decorist.com, an online interior decorating service that matches a consumer with a designer to design a room together in one's style and budget. The catalog is sprinkled with new Pro Tips throughout from designers on Decorist.com and encourages readers to go to bedbathandbeyond.com/decorist to learn more.

Decorist promotion


In summary, most of this #O2O goodness can be done by any retailer with nominal investment. Marketers just need to be willing to invest in strategic planning and coordinating efforts across departments to do what's best for their brand and customers!

###

Monday, October 23, 2017

How I Became a Data Plumber

The other day I realized that big data, business intelligence, and dashboards may sound sexy in my strategy and analytics world. But all that and the insights they promise is not really possible without the less glamorous work of what I call "data plumbing." Yes, mom, all my years of schooling and work experience has led me to a career as a plumber =) Having a modern plumbing system in place is not only critical for your home, it's also essential for marketing.


Let me share a real life example of one of the many things I do as a Data Plumber. In this example, the role of the Data Plumber is to make sure all the pipes are connected end-to-end for more precise data to flow to improve tracking and optimization.

Here's a common use case: To optimize paid search campaigns, we need keyword level data for offline conversions. This happens a lot for lead gen campaigns where sales are closed offline, especially for B2B clients and B2C clients whose products or services require more hand holding than ordering a book from Amazon to close the deal.

First, I work with the media team to generate and pass a unique click ID to the landing page when a user clicks on an ad. The click ID will provide granular keyword level tracking. That's the first upstream plumbing connection from the search engine to the client's site. This is like getting water from the main line in the street to your house.

Then we need a way to pass the click ID to the client's lead management or CRM system. This is where years of experience talking "tech" with developers and "data fields" with database administrators pays off as I make the business case on why the Marketing Department needs these changes.

I visit the client's CRM team to see if they can create a field for me to house my new incoming click ID from the client's site. In plumbing speak, I need to make sure there is a faucet in the house that can receive the water from the street once I hook up the pipes under the house.

Once that is taken care of, I am off to work with the web development team to pass my click ID at the point of lead generation, usually when a user submits a lead gen or order form on the site. Normally this involves altering the API to the lead management/CRM system to capture the click ID upon form submission. Now we got pipes to allow water to go from the street to the kitchen sink!

But we're not done yet. We need a way to drain the used water back out of the house. I'm back with the DBAs and the CRM team to create a way to send us the data we need via an ETL or dropping a file regularly to a FTP server. We are creating a conversion file that passes every lead and sale with our associated click ID back to the media team's search campaign management system...ideally in real-time (or near real-time) for bid optimization, as well as reporting.

Almost there...so I go back to where I started with the search team. We create a process where they can consume the client's conversion file and match the data back to click ID. What's powerful about all this is you don't just tell the campaign management tool that a keyword led to a sale or not (which is binary), but you can also pass the amount of the sale, product type, and even the customer segment for even more insightful reporting!

Without such plumbing in place, you can optimize at the keyword level on web leads, but not sales. Now, you may find you've been spending a lot of media budget on a keyword that generates a lot of leads, but has either a low sales conversion rate or a higher CPA (cost per acquisition) than you thought because you've been optimizing to CPL (cost per lead). Or perhaps you weren't getting the quality of sales or the right customer or product sold than you thought for some keywords. That's like having hot water enter your house, but only warm, foul-tasting water may be coming out at the tap unbeknownst to you because you just saw water coming out of the tap (assuming everything was working fine), but you never felt the temperature or tasted the water to realize something was wrong.

So, there you have it. Just a day in the life of a Data Plumber. =) Actually, in this case, the above would have taken me weeks, not a day, to setup in partnership with my client, media teams, web dev teams, and CRM/database administrators. But when it's all done, it feels great!

##


Sunday, November 13, 2016

Social Content Optimization: The Rise of Social Copywriting

At the turn of the century, savvy marketers realized they needed to optimize their websites for search engines in order to be found online. This led to the birth of an entire industry that sprung up to help companies with search engine optimization (SEO). SEO became an art and science, always trying to keep up with Google to "game the system" for search visibility. Traditional copywriters had to be re-trained to write for SEO. Analysts focused on keyword research, keyword density on a page, tags and meta data, etc.

While SEO is still important today, writing for social has become increasingly important for social networks and good ole fashion websites. You need to think about the best # hash tag to use or the type of content to convey your marketing message (Does this call for a video or photo?).

Using social listening tools can help marketers see what is trending and to inspire content developers and copywriters. Who can forget @Oreo's awesome and timely tweet during Super Bowl 47's blackout?


Such #winning moments don't happen very often like that. So it's important to note that it's not about hitting a home run every time at bat. Instead, it's about being smart in order to get a single or double each time you post.

Using tools like Quintly, you can see engagement of your or other user's content by type and time of day or day of week (see example charts below). Then you might learn that Mondays at 3pm is the best time for posting that cat video! =) Right time, right content.

User Posts By Day of Week - Quintly
Post Reactions Table - Quintly


At a Quintly Meetup event a few months ago, a team from IAC talked about how they are taking an analytic-driven approach for publishing content on their recently launched Throwback.to site and Facebook page. They were using Quintly reports on a weekly basis to empower social media community managers to measure user reaction and engagement on content in order to make decisions on what to post next. The site is quite an interesting experiment.

So, as you think about what to post online, keep in mind social content optimization. And be sure your content is not only searchable, but likeable and shareable.

##

Wednesday, June 8, 2016

Website Overlays Pose Technical Challenges for Marketers

Overlays, also known as interstitials or lightboxes, are pages that appear before or over an expected content page of a website.

They are often used as marketing “pop ups” that look better than the old pop up windows of yesteryears. At first, they were commonly used for serving ads while the main page loaded underneath. Nowadays, you'll see them used for all sorts of reasons:

Special promotional offers when users first visit a site
Age verification prior to site entry
Newsletter or email sign-ups
Solicit users for site survey
All of these use cases are intended to “interrupt” the normal user experience to get the user’s attention for a brief moment, but is not intended to prevent the user from easily continuing on his/her merry way to the intended content page. In theory, a simple Close [X] click is all that is required (with the exception of the age verification use case).

Lately, I have noticed some sites use full-page overlays as part of the core site experience with the belief that it creates a better user experience. In these cases, a content page that would normally be a “regular” HTML page with a unique page URL is instead an overlay without a URL.

Full-page overlay example
While it may be a better UX, here are some challenges I have come across with overlays as "real" content pages.
  1. Not great for SEO - Search engine spiders are not able to index these overlays. 
  2. Without a URL, you can’t drive traffic to the page via paid media to use as a destination landing page. Users also can't share the overlay since there is no URL, severely limiting social sharing and viral marketing. 
  3. Tracking, specifically web analytics tools like Omniture and Google Analytics, will not include basic metrics like page views from the standard configuration. A workaround like virtual page views can help address the tracking issues, but it does require custom coding from a developer who knows what s/he is doing. 
  4. Sometimes if not done well, the responsive design layout can lead to an awkward user experience. My pet peeve: a small [X] to close the overlay or the [X] is off the screen on my mobile device and you have to try to expand the screen or swipe to get to the [X]! 
Viant overlay ad is too wide on this MediaPost mobile page

So while overlays may be nice for special marketing offers or confirmations that do not contain critical content you want indexed, web developers should be careful using it for content-rich pages to avoid a #FAIL.

###

Saturday, February 6, 2016

Predicting Super Bowl 50 Winner with Facebook Data: Carolina Panthers

Here we are on the eve of the biggest sporting event in the world, Super Bowl 50.

Last year, I wrote about how I used social media benchmarking tool Quintly's Facebook data to predict the Patriots as the winner of Super Bowl XLIX based on the interaction rate on the Seahawks and Patriots Facebook pages. Based on how the Patriots' Interaction Rate that last Friday before the Super Bowl, I thought the Patriots would win it.


But let's be honest, football fans, the Seahawks should have won that game if they just handed the ball to Marshawn Lynch and that absurd interception by Butler would and should never have happened. But I digress...

So, here I go again this year, back to the Quintly well to see who it predicts will win Super Bowl 50.

Using my same methodology as last year, I looked at the Facebook Interaction Rate for the past 12 days for the Broncos and Panthers.

Panthers consistently higher than Broncos

As one can see, the Panthers have had about 2-5 times the engagement of the Broncos' Facebook page every day. This is despite the fact that Denver has twice the fan base and more than double the number of posts during this time:


It turns out that the Panthers' content, especially photos and videos, generate much higher interaction rates than the Broncos:


Analyzing more closely what might be causing the higher Panthers interaction rates, it's not due to a few photo or video posts. It's quite common for a post to get 2000 or shares, while the Broncos usually see only hundreds. In fact, the Panthers Facebook fan base just seems more engaged overall. Maybe it's because they are coming off an amazing year, QB Cam Newton is a rock star, or all those free football giveaways to kids after a touchdown is generating tons of goodwill!


While I would love to see Peyton Manning win one more Super Bowl before he retires, it does not look likely. Based on this analysis, the Super Bowl 50 winner will be the CAROLINA PANTHERS.

Enjoy the game, folks!

Disclosure: I am an advisor to Quintly.

##