Showing posts with label social media. Show all posts

Saturday, April 11, 2020

Covid-19 Digital Playbook

With shelter-in-place (SIP) and a likely recession due to the Covid-19 coronavirus pandemic, now is the time to double down on digital marketing and sales!

With store closures, many retailers, such as Nike, are reporting Black Friday sales levels and conversion rates! And I've been seeing similar results for my clients.

In fact, in its recent quarterly report, Nike's CEO said it was able to engage its fans via its app and other digital channels while they were quarantined at home, and their free exercise services translated into strong digital sales that helped offset store closures.

Some brands or OEMs who previously had channel conflicts from wholesale/retail partners or their own brick-and-mortar stores suddenly see their direct-to-consumer channel as the only game in town during SIP.

That makes this a critical time to dig into your website and mobile app analytics!

See what part of the site is getting the most traffic, what's selling now that wasn't before, what is the makeup of the customers who are shopping now vs. before, where are users dropping off or hitting UX roadblocks?

For many of my clients, I've seen a spike in mobile web and mobile app traffic especially throughout the day and not just during commute hours. No surprise as people are home due to SIP. Also, historically, lots of office workers shop on their work desktops during the weekdays. It's not uncommon to see high conversions on Mon mornings before lunch as workers tackle their "to do" list after a relaxing weekend. But suddenly they don't have access to those work computers and must go online on their phones. So make sure your site is optimized for mobile, now more than ever!

Re-evaluate all your advertising

Online ad prices, especially banner, native, and video ads, that run on publisher sites are dropping as supply outstrips demand because advertisers have pulled back on spend because of SIP (e.g., travel industry can't really promote bookings), recession fears, and brand safety concerns (i.e., brands don't want their ads to show next to coronavirus content, especially on news sites). However, if you are less brand sensitive or develop a more targeted blacklisting strategy, you can make out like a bandit for your media buys. For example, Facebook CPMs have fallen to their lowest levels in 2 years.
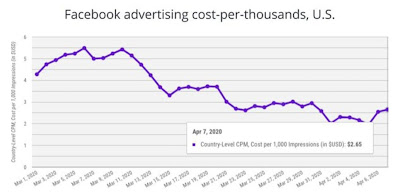
Facebook CPM Falling (Source: Gupta Media)
It's also a good idea to assess the competitive media landscape. You may discover some competitors have pulled back on their paid advertising in search, display, social, video, or mobile apps. Time for you to grab market or mindshare, likely at lower ad prices as mentioned above. For some of my retail clients where Amazon used to compete with them on search, there's been less competition. Not that Amazon doesn't have the money to bid against them, but more likely because Amazon has more than its hands full now from organic traffic with everyone turning to the online retailer during SIP. (More on that below.) So check your Google Auction Insights reports. On the flip side, depending on your industry, you might see quite the opposite competitive pressure and everyone is getting more aggressive to capture as much demand as possible right now. Think about the fiercely competitive online video conferencing space right now where you have Zoom, GoToMeeting, Microsoft Teams, and Webex duking it out.

I expect performance media campaigns to see less budget cuts than branding campaigns.

Also, make sure your ad messaging is on target and appropriate for these times. For example, yesterday morning I heard a local radio ad that asked "Taking your kids to school? Listen to us in the car." Really? Schools have been closed for a month during SIP! Someone at the station clearly sleeping behind the wheel.

Take stock of and promote your most relevant product and service features during these times.

By now, as a consumer, every company has probably sent you an email and driving you to their Covid-19 landing pages to explain how they are reacting to the pandemic and SIP. And most importantly, what special services they are offering during these uncertain times.

So, as a brand, what are you going to promote?

If you have interest-free payment plans or "layaway" plans like Afterpay, it's time to promote that. Amazon features it prominently on higher ticket price items (see below). Some auto companies have rolled out 0% interest, 72-month auto loans even!
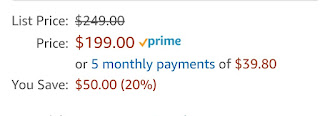
Amazon's interest-free payment plan

Right now consumers are very concerned about supporting small businesses who risk going under. For smaller businesses who are reaching out to their community for help, now's a good time to setup and promote online gift cards. Square, which is quite popular with small businesses, has even created a Give & Get Local site to make it easy for local merchants to promote their e-gift cards to consumers. I've seen when merchants promote this in email campaigns, consumers are buying them to keep their favorite businesses afloat, hoping to patronize them later when we get through this. Facebook is also offering small businesses grants.

Offer curbside pickup following social distancing best practices? Promote that. Are your shipping and delivery times still unaffected? If you compete with Amazon, you may have an advantage now against the Prime shipping program as Amazon is swamped with traffic and orders, forcing them to prioritize some items over others. I don't blame them. I was about to buy an item that was eligible for Prime shipping. But at checkout, it said it won't ship for 1-2 months! That's crazy. #abandoncart

Amazon delayed shipping warning
Sports retailer Sports Basement has been sending out emails that promote online events to help customers stay fit, such as live workouts with a trainer via video conference and healthy recipes to try at home (side note: there has been a spike in baking and home cooking with SIP). And of course, discounts for shopping online! Similarly, REI has 6 Ways to Mix Up Your At-Home Workday. Both are great examples of brands staying true to their brand positioning while producing relevant, engaging content for their customers.

Sports Basement workout tip
Also, make sure you are monitoring online chatter using social media tools. How are consumers reacting to your company's response? For many brands, they are dealing with significant customer service complains on social media, online chats on their sites, and of course their call centers. But also use this data to see what's trending? How do you weave your brand into the conversation? The key is to be authentic, empathetic, and not too salesy.

Get the word out!

When you've identified relevant content to share with the community, it's time to put the CRM team and tools to work! Leverage that email database you got! For small businesses using Square, Square is offering Square Marketing, its basic CRM program I previously reviewed, for free right now. Yelp is also offering some of its premium marketing services for free for small businesses. Take advantage of these tools! Most are very easy to use without a huge learning curve.

Of course, take it to social media channels. Remember when just a few weeks ago, the government and consumer privacy advocates wanted to take down Facebook and Big Tech? Now, consumers are spending more time than ever on Facebook and almost every single social network has seen engagement shoot through the roof! When you do post, do some #hashtag research to maximize visibility.

And this goes without saying, but make sure your website can handle increased traffic, especially if you're a retailer and your stores are closed. You might also consider a code freeze like most online retailers normally do Nov-Dec. Don't risk rocking the boat when it's the only sales channel you got right now!

Lock-in long-term behavior changes

Lastly, all this time at home and SIP has forced consumers and businesses to change their behavior, largely favoring online activity, and you should take advantage of making these behaviors long term habits. Just to name a few benefactors -- online video conferencing, online banking/mobile app banking, online grocery delivery, esports, virtual medical professional services like SteadyMD or Talkspace, not to mention multi-channel retailers who have struggled to get in-store shoppers to go online or use their mobile app. Post-SIP, all these industries will benefit from an injection of new users; the key will be to keep as many as they can as paying customers for years to come.

My Covid-19 Digital Playbook:
  1. Dig into your web + app analytics data for insights
  2. Re-evaluate your media buys and messaging
  3. Develop relevant content for Covid-19 behaviors due to SIP and be useful to consumers
  4. Be active on social media and email channels
  5. Be prepared for how to exploit long-term behavior changes after we get through this to capitalize on your short-term wins
Now I only wish there was a digital solution for haircuts because I need one badly! =( And I don't just mean an AR filter for my video calls or socialpost!

Stay safe and sane out there...

## 

Sunday, March 3, 2019

YouTube Should Make Channel Owners Moderate All Comments To Serve Ads


Controversy is brewing again between YouTube and major advertisers. In case you haven't heard, YouTube has recently disabled comments on videos with minors due to predatory behavior. That was after major brand advertisers, such as Disney and Nestle, pulled their ad budgets. That tends to get YouTube to act.

And YouTube says they've fast tracked a new tool to identify inappropriate comments automatically.

I don't think this is solved by technology alone.

If a person or company wants to have a YouTube channel, it implies they want to connect with users. And with that should come a serious level of responsibility to monitor what happens on your channel and one can't expect technology to do it for you.

I also feel like the broader user community can't be expected to flag issues for YouTube. That could help be part of a larger solution.

YouTube can't put the burden on advertisers either to flag inappropriate comments because that's not an advertiser's core competency. Advertisers just want to make a media buy and trust their ad will be shown in a brand-safe environment.

Instead, what if YouTube put the responsibility on YouTube channel owners who wish to monetize their channel to actively moderate their comments? If you choose to sign up with YouTube to make your channel eligible for showing ads, YouTube should set all comments to require moderation by the channel owner and not post comments automatically. This would force the channel owner to ensure a brand safe environment. Otherwise, YouTube should not allow a channel to run ads. This has the benefit of aligning incentives for all parties because both Google and the channel owner want to make money from advertisers and advertisers want to invest in online video advertising.

Some owners of popular YouTube channels may balk at this idea, saying they get too many comments or views to moderate them all. If that's true, they must be making lots of money from ads! So guess what? You have to invest some of that money on moderators or community managers to continue to make money and maintain your brand-safe advertising environment!

As they say, it takes money to make money...

##

Thursday, September 6, 2018

Marketing Analytics: Why I Obsess Over Rates

I don't mean interest rates on my savings account, which is still paltry BTW. =)

I see marketing analytics reports all the time from clients that focus on absolute numbers like visits, conversions, clicks, opens. These are good to know, but I find these metrics meaningless in a vacuum. Is 10,000 clicks in a month good? It depends...

Instead I like to focus on relative metrics like calculated rates and ratios.

Rates are great to track metrics over time, to offer context, and to compare to industry benchmarks because rates are normalized. This means you can compare rates over different time periods to see if something is wrong or if something is doing surprisingly well all of a sudden. This also allows a smaller company to compare themselves to a larger company, generally speaking.

Let's look at how to use rates in common digital marketing reports to reflect the most insights.

Website Analytics

Example 1: Conversion Rates. Every website needs to have a primary goal or "conversion" event that is clearly and cleanly tagged on the website. That can be an e-commerce transaction or lead gen form completion. Everyone always then tracks the number of "conversions" each week or month in absolute terms.

Most, but not all, clients look at conversion rates. Yes! But there are multiple ways to define "conversion rate." Some define it as conversions / site visits. That's not bad and Google Analytics offers this in their standard reporting. The problem with just looking at this "start to finish" conversion rate is it does not help you identify where the leak in the conversion funnel is. Furthermore, this is often a very low number like 0.05% so it's really hard for senior management to fully understand such a metric.

What every marketer should do is also break down the customer journey into smaller bite-size paths. In the illustration below for an online lead gen site, by simply breaking the customer journey in half to calculate a Consideration Rate and a Completion Rate, you now have more actionable insights.

Purchase Funnel Rates
This helps identify where you have leakage in the funnel and how to address it. For example, if form completion rate is low, maybe your form is too long or confusing. Also, this completion rate should be easier to digest because it usually ranges between 5%-50%. So if you have a completion rate of 10%, you can ask yourself does that feel low when 9 out of 10 people bailed. Much easier to comprehend than the 0.05% conversion rate example above.

This form completion rate is also ideal for industry benchmarking because the "scope" of your metric is just a form and form completions. If you used the 0.05% conversion rate, the scope of that metric is all visits to your site for whatever reason and all the pages on your site. So it's really hard to compare apples to apples on such a broad conversion rate. Take retailers who live and die by shopping cart abandonment rate, which is the reverse of completion rate. Industry-wide cart abandonment rates are relatively easy to find and benchmark to your own cart abandonment rates.

Before moving on from this example, I wanted to mention the Consideration Rate. This is worth monitoring because if it's low, it means users are not showing any interest in your product. So you have to ask yourself questions like "Is our CTA not prominent enough?" or "Are people really not interested in our product offering?" The former can be a user experience issue, while the latter is a product or product marketing issue.

Example 2: % of Totals. This is a very simple ratio and calculation, great for providing a frame of reference. Take the classic Top Pages by page views report.

% of Total Pageviews Example

Most clients will quickly grab this data from their web analytics tool that shows pageviews in rank order, but sometimes discard the % that is often in the dashboard. I like to also provide the third column that is % of Total Pageviews because then you can better appreciate how popular a page is relative to other pages on your site. It's usually harder for senior executives to understand if 72K pageviews for the Product Overview page is low or high, but 25% of all pageviews is easy to grasp and to conclude it's very high for one page to garner.

I calculate this % of Total for a lot of site metrics beyond page views, such as % of Total Video Plays and % of Total Downloads. Again, the goal is to show if activity is concentrated among a handful of content or assets or more fragmented and distributed across all of them. If it's more concentrated, figure out what makes them so popular and do more of that!

Example 3. CTR. Clickthrough rates (CTR) are often associated with paid media ads and email links. But I like to calculate CTR for website analysis when analyzing CTA button clicks or on-page analysis to see what users chose to click on when presented with a host of options. Here's an example from a directory search results page. CTR is calculated for each link based on link click / page views. This is also a more visually appealing way to show these stats than a standard table. I also like to develop a similar slide for CTRs on the global navigation menu. One critical tip: usually you must setup custom click tags to calculate the CTRs I've discussed.

CTR Website Example
In terms of benchmarking, CTRs are great because you can compare pre- and post-launch CTRs if you redesign your website.

Email Performance

Most clients already focus on open rates and CTR. 👍 But I still see reports like this occasionally:

Email Report Without Open Rate Example
For most marketers, the opportunity here is for benchmarking rates. Epsilon publishes a great quarterly report that is free that is full of email benchmarks by industry and by types of emails (e.g., editorial/ newsletter, marketing, service)!

Last comment on email metrics. Don't forget to look at CTOR (Click-to-open rate), which is clicks / opens. CTOR is different than CTR, which is clicks / delivered. Monitoring and benchmarking CTOR can help you address issues with the content or CTA within the email body and usually rules out an issue related to the subject line.

Social Media Campaigns

Engagement Rate Example. For social media campaigns, paid or organic, one of the most popular primary KPIs is engagement rate. Most marketers define engagement rate (a.k.a. interaction rate) as (reactions + comments + shares) / posts. But if I'm a marketer, what constitutes a good engagement rate? A social media analytics tool, such as Quintly, is great for answering this question. It not only allows you to compare yourself to other competitors, but it has also created industry averages. In the example below, let's say I'm BMW USA. I can compare not only my Interaction Rate to direct competitors Audi and Mercedes, but Quintly also shows the average Interaction Rate for the Top 10 US Auto manufacturers. Quintly has other useful social media benchmarking tips on a recent blog post so I won't go into any more details here.

Quintly Interaction Rate Example

Paid Media Campaigns

Example 1: SEM & Display. Almost all media managers report out on CTR, CPC, and CPM for paid search and display campaigns. Yay! The suggestion I have here is be sure you ask your media partner or publisher who you are working with for industry benchmarks on these common media metrics. For example, your Google rep will often put together a quarterly report showing you your SEM spend, CTR, etc., relative to other advertisers in your category or industry (see example below). They will usually slice this by brand vs. non-brand and desktop vs. mobile. One caveat with these Google benchmarking reports. It will almost always show you are under-spending and under-performing because you are being compared to a Category Leader Average not the entire Category Average. Google obviously has an incentive to motivate you to spend more 😉

Google SEM Benchmark Example

Similarly, for display campaigns, find out what's the industry CTR from your vendor. If you're running rich media unit ads, find out what's a good engagement rate for user interaction with your unit in your industry.

Most digital advertisers also look at efficiency using Cost Per Acquisition (a.k.a., Cost per Conversion or Cost Per Lead). I also like to look at Click-to-Conversion rates.

Example 2: Video. For video ads, you need to look beyond video starts or plays. For sure, look at video completion rates. Or even better, look at milestones like quartiles. Below is an example of a Video Completion Rate Funnel with quartile milestones. This helps you identify where people are dropping off. For example, in pharmaceutical videos, users often drop off when the super long Important Safety Information (ISI) begins to play so I often place a milestone marker at the ISI start.

Video Completion Rate Funnel Example

For benchmarking purposes, ask your media partner or publisher for average completion rates for your industry. For example, they should be able to tell you the average completion rate for a :30s video is 30% in the financial services industry.

Summary

So there you have it. Now you know why and how I am obsessed about Rates and Ratios for my clients' marketing analytics reporting. All of the above are very simple concepts. You just need to spend a little bit of extra time in developing your measurement and tagging strategy and also on reporting. But in return, you become awesome at storytelling with data!

##

Disclosure: I am a strategic advisor to Quintly.

Thursday, June 7, 2018

Life Without Ad-supported Products and Services


Got privacy concerns? In a recent study, 63% of U.S. adults (nearly 2 out of 3 people) said they would be unwilling to give a company access to their personal data for targeted advertising in exchange for a free service. Shockingly unbelievable! Despite all the recent consumer and political fallout about consumer privacy and ad targeting, what would life really be like without advertising-supported products and services?

Let's think about that, shall we? Starting with the 800-pound gorilla...

Google Search: You could probably still use this, but without behavioral targeting and tracking, paid search ads may seem less relevant because it'll be like going back in time 10 years when results were largely based on keywords and bids from the auction model. You may think you're mostly interested in organic search results and probably don't care about the paid listings. But don't expect Google to continue investing in indexing organic results if it can't pay its employees! Here are some alternative private search engines to Google.

YouTube: Google paid a lot of money for YouTube ($1.65 billion) and they have spent years trying to monetize it. Only recently, thanks to the growth of mobile and video advertising, does this acquisition appear to be paying off. YouTube has struggled for years to get consumers to pay for a subscription. Without advertising, YouTube would essentially be gone. There is really no alternative to this platform. Even Vevo realized this recently and announced the shut down of its consumer branded sites to focus on its YouTube channels!

Google Maps: This is the most popular mapping and GPS/driving direction service.  Google has tried to sell ads based on location and behavioral targeting. Other online maps also rely on ads. So if you want to avoid ads 100%, you will need to buy a Garmin or a similar device that makes its money from hardware sales, not advertising.

Gmail: You might think Gmail is ok as Google claims it no longer scans emails to serve ads. But it is still scanning emails in the name of personalization. For example, Google knows when your next flight is leaving, and whether or not it has been delayed, based on emails you get from airlines and travel booking sites. Also Gmail has an ad product, although you may never notice the ads if you have your settings set to not display Promotions. But Gmail ads do offer advertisers lots of targeting options. Where do you suppose Google gets those signals from??? Lastly, I feel Gmail is a Trojan horse play for Google to incentivize users to create a login (and stay logged in for checking email constantly) and user profile, which in turn can be used for your login across all Google products in order to track you with more precision across the web and across devices to serve better ads within its ecosystem. If you don't want an ad-based "free" webmail service, you may have to start using your ISP's "free" email address that came with your broadband service (e.g., Comcast, AT&T). The trade-off though is the switching cost is high if you ever want to leave your Internet service provider because you will have to tell all your friends they need to email you at a new email address. That happened to me years ago when I switched from Mindspring to Gmail.

Android Phones: Know that Android-based phone you have from Samsung, LG, or Motorola? While the operating system was free to phone manufacturers, Google uses Android as yet another Trojan horse to get mobile users to use its popular ads-based mobile apps, such as those described above, that are pre-loaded on the phones to protect its dominant advertising position in desktop and mobile devices. One alternative is to get an iPhone.

...And then there's Facebook

Facebook: By now, we all know how Facebook collects tons of data about users without their knowledge in order to provide incredibly powerful targeting capabilities for advertisers. As a digital marketer, I can attest to how precise and effective their ad products are. But as a consumer, you won’t easily find another social network where all your friends are.

Instagram: Thinking about leaving Facebook to Instagram like a teenager? Not so fast, Instagram has largely adopted the same ad platform as Facebook.

WhatsApp: How about WhatsApp? The founders built the app based on privacy concerns and started out charging 99 cents a year. When you have over 1 billion users, that's not a bad revenue model. Unless of course someone (i.e.. Mark Zuckerberg) paid you $22 billion for the company 😉 If you haven't heard, the founders of WhatsApp have fought Facebook executives for a while to keep ads off WhatsApp and are leaving Facebook over this philosophical difference. And it seems ads are coming soon to WhatsApp.

All other social networks, like Snapchat, are also ad-based. So there's no alternative service at scale really. Perhaps this will lead to a renaissance when people will actually call people on the phone again or meet friends face-to-face.

Other popular ad-based services

Yelp: Who doesn't love Yelp for recommendations? The company has ads, but it has limited targeting abilities, mainly based on a user's keyword search and location. So you can decide if that creeps you out. Also, Yelp has been building out other revenue streams targeted at businesses, like request-a-quote, that is not ad-based.

News sites: Most are ad-supported, but many don't make enough money to offset their declining print revenue. Savvy papers with loyal followers, such as WSJ and NY Times, charge a subscription and some have tested micropayments per article. But if you don't like ads, your selection of news sites is quite limited.

Mobile games: Many casual mobile games are still ad-supported. Part of the reason I think that's the case is because ad platforms have made it easy for developers to integrate ad units within their game for monetization. Many don't want to charge a fee for each download, thinking it will negatively impact app adoption. (True!) Some have found success with a freemium model, like Fortnite. But selling virtual goods does require developers to work harder to figure the "hook" to get users to pay and to develop a store in the app to sell these virtual goods.

TV: TV shows are still largely ad-based. TV started that way and some could argue there is a sea change. Netflix has built a very successful subscription model with original content and zero ads. But most video on demand or over the top (OTT) TV streaming services are currently testing a hybrid model that includes a "modest" monthly subscription fee and targeted video ads. Think Hulu, Sling TV, Directv Now, and YouTube TV.

Not all hope is lost

Not to be all doom and gloom if you don't want to use ad-supported products, as there are a few companies that still offer products and services not based on advertising.

Amazon/Amazon Prime: If you're not one of the 100 million people on Amazon Prime, you should be! This paid subscription gets you so many benefits, that I can't even list them all. Go read it here for yourself. That being said, Amazon has been slowly developing a burgeoning advertising business on its site because most people start product searches on Amazon rather than Google. As this becomes a growing revenue source for them, how long before Amazon engages in behavioral targeting for advertising, much like how it has successfully mined customer browsing and purchasing data on its site for its recommendation engine and tested ad-supported, discounted Kindles?

Apple: Apple is the poster child for anti-ad-supported products, even if its legion of app developers depend on ads for monetization. Not a week goes by these days that CEO Tim Cook is not poking a stick at Facebook and its lack of consumer privacy practices. But Apple is a highly-profitable hardware and services company, not an advertising company like Google and Facebook. So product sales and subscriptions will dominate for a long, long time!

Microsoft: Many of us interact with Microsoft via its Windows and Office products. As such, it's primarily a B2B company and makes a ton of money from charging businesses and home users for subscriptions to Office and operating system licenses to computer manufacturers. And their Azure cloud computing business is growing like gangbusters that is also subscription-based. It sells some Xboxes to consumers at retail and also generates subscriptions from online gaming. It does have the Bing search engine and an ad business. But for the vast majority of consumer's interactions with Microsoft products and services, they're not really ad-supported.

Netflix: Unlike the OTT TV streaming services mentioned above, Netflix has scoffed at an advertising revenue model and is focused on subscriptions. If their stock price is any indication, they are doing just fine without ads!

Spotify: Spotify and other music streaming businesses all seem to have landed on a $10/mo subscription model. Some like Pandora still have an ad-supported "free" option. There is also talk of Spotify developing an ad business.


So there you have it. Can you 2/3 of Americans out there really live without these ad-supported services? And how much can your wallet take to keep paying for existing subscription-based services, like Amazon Prime, Netflix, Spotify, Hulu, etc.? The dollars add up quickly, don't they?!?

##

Friday, September 22, 2017

Taylor Swift's UPS partnership to promote new Reputation album - WHY!?!?

Spotted a huge picture of Taylor Swift yesterday in the street. Thought it was one of those moving billboard trucks until I realized it was a UPS truck!


First of all, I think it's interesting that UPS is pimping out ad space on its trucks, like a public transit bus. I didn't even realize they had an interest in building out an ad business. Perhaps the fight with FedEx has them looking to expand to other revenue streams. It's not a bad idea for UPS to monetize that huge boring brown space across their fleet of trucks.

Some might say the UPS partnership is a good offline marketing vehicle. It's 100% share of voice. And people don't go to record stores (R.I.P. Tower Records!) anymore and even the Best Buys and Targets of the world aren't really selling many physical albums these days to warrant in-store promotions as users are digitally streaming or downloading music.

But if you're TAYLOR SWIFT, why do you even need to spend money to advertise your new album? She's world famous with reporters, radio DJs, bloggers, and her fans hanging on her every word and ready to buy her latest music!

She's recently released 2 singles, Look What You Made Me Do and Ready For It, from the new Reputation album weeks apart and both are getting lots of air play!

Not only that, but social media was supposed to be the great equalizer for artists to build direct connections to fans. And it certainly has been for Taylor. She has a huge social media fan base:

YouTube (Taylor Swift) - 1.7 MM subscribers
YouTube (Taylor Swift VEVO) - 24 MM subscribers
Twitter - 86 MM followers
Instagram - 103 MM followers

All she has to do is post on her own social media channels and call it a day.


In fact, Tay Tay is already doing it. Her YouTube channel is totally promoting her new album's drop date of Nov 10th:


It's also on the comments of her Look What You Made Me Do video on TaylorSwiftVEVO:


Her other profiles are all promoting it too. In fact, it's a great example of integrated marketing as all the channels have the same Reputation album cover photo and call to action to get her album on Nov 10th. You may recall she caused an Internet frenzy when all her social accounts went dark last month to prep and coordinate all this stuff.

Taylor has always been a very respectable, smart business woman. But I just don't get why she did this UPS deal...

###

Sunday, November 13, 2016

Social Content Optimization: The Rise of Social Copywriting

At the turn of the century, savvy marketers realized they needed to optimize their websites for search engines in order to be found online. This led to the birth of an entire industry that sprung up to help companies with search engine optimization (SEO). SEO became an art and science, always trying to keep up with Google to "game the system" for search visibility. Traditional copywriters had to be re-trained to write for SEO. Analysts focused on keyword research, keyword density on a page, tags and meta data, etc.

While SEO is still important today, writing for social has become increasingly important for social networks and good ole fashion websites. You need to think about the best # hash tag to use or the type of content to convey your marketing message (Does this call for a video or photo?).

Using social listening tools can help marketers see what is trending and to inspire content developers and copywriters. Who can forget @Oreo's awesome and timely tweet during Super Bowl 47's blackout?


Such #winning moments don't happen very often like that. So it's important to note that it's not about hitting a home run every time at bat. Instead, it's about being smart in order to get a single or double each time you post.

Using tools like Quintly, you can see engagement of your or other user's content by type and time of day or day of week (see example charts below). Then you might learn that Mondays at 3pm is the best time for posting that cat video! =) Right time, right content.

User Posts By Day of Week - Quintly
Post Reactions Table - Quintly


At a Quintly Meetup event a few months ago, a team from IAC talked about how they are taking an analytic-driven approach for publishing content on their recently launched Throwback.to site and Facebook page. They were using Quintly reports on a weekly basis to empower social media community managers to measure user reaction and engagement on content in order to make decisions on what to post next. The site is quite an interesting experiment.

So, as you think about what to post online, keep in mind social content optimization. And be sure your content is not only searchable, but likeable and shareable.

##

Saturday, February 6, 2016

Predicting Super Bowl 50 Winner with Facebook Data: Carolina Panthers

Here we are on the eve of the biggest sporting event in the world, Super Bowl 50.

Last year, I wrote about how I used social media benchmarking tool Quintly's Facebook data to predict the Patriots as the winner of Super Bowl XLIX based on the interaction rate on the Seahawks and Patriots Facebook pages. Based on how the Patriots' Interaction Rate that last Friday before the Super Bowl, I thought the Patriots would win it.


But let's be honest, football fans, the Seahawks should have won that game if they just handed the ball to Marshawn Lynch and that absurd interception by Butler would and should never have happened. But I digress...

So, here I go again this year, back to the Quintly well to see who it predicts will win Super Bowl 50.

Using my same methodology as last year, I looked at the Facebook Interaction Rate for the past 12 days for the Broncos and Panthers.

Panthers consistently higher than Broncos

As one can see, the Panthers have had about 2-5 times the engagement of the Broncos' Facebook page every day. This is despite the fact that Denver has twice the fan base and more than double the number of posts during this time:


It turns out that the Panthers' content, especially photos and videos, generate much higher interaction rates than the Broncos:


Analyzing more closely what might be causing the higher Panthers interaction rates, it's not due to a few photo or video posts. It's quite common for a post to get 2000 or shares, while the Broncos usually see only hundreds. In fact, the Panthers Facebook fan base just seems more engaged overall. Maybe it's because they are coming off an amazing year, QB Cam Newton is a rock star, or all those free football giveaways to kids after a touchdown is generating tons of goodwill!


While I would love to see Peyton Manning win one more Super Bowl before he retires, it does not look likely. Based on this analysis, the Super Bowl 50 winner will be the CAROLINA PANTHERS.

Enjoy the game, folks!

Disclosure: I am an advisor to Quintly.

##

Wednesday, December 9, 2015

The 3 C's of Social Media Marketing Tools

Every strategist has heard of the 3 C's model for business strategy:
  • Company
  • Customer
  • Competition
The 3 C's can also be applied to social media marketing tools.


Company = Social Media Management Tools

How do we manage and publish content across multiple profiles and find out what works best?

This is all about how the Company expresses their "human side" online and engage with its customers. Once content is produced, companies need to distribute all that content in the right social spaces. Few companies manage each social space (e.g., Facebook, Twitter) directly from the sites themselves. Most brands use social media management (a.k.a., publishing or community management) tools to manage content and plan, schedule, and track the success of their social media campaigns. Popular tools in this category include Hootsuite and Buffer.

Customer = Social Media Listening Tools

What are customers saying?

Listening, or conversation monitoring, tools have been around for about a decade. I consider such tools the world's largest consumer research panel...on STEROIDS!

Conversation monitoring tools can range in price and sophistication. On the free end of the spectrum, one can use good old Google search, as well as vertical search engines like Omgili. But these free tools just return a list of search results -- mainly unstructured data that is extremely hard to analyze.

Then on other end, there are powerful, useful tools such as Radian6 and Brandwatch.

These tools crawl the web based on keywords. Data is organized around mentions, sources/source types, or influencer/author. Listening tools are great for qualitative insights, such as trending topics and finding key influencers, and identifying places on the web (not necessarily social networks) where people are talking, such as forums, blogs, and communities.

The main outputs from such tools are tag clouds, key topics, sentiment/tonality, and influencers.

Competitor = Social Media Analytics Tools

What and how is the competition doing relative to our Company? What's their level of engagement?

This is a newer category that has been around for about half the time of listening tools. These tools provide competitive benchmarking between branded social media profiles. I personally think calling them "social media analytics tools" is a little bit vague and doesn't really convey what these tools do. So I like to call them "social media profile analytics tools."

Unlike listening tools, these tools crawl pre-defined social media profiles that you configure (e.g., @starbucks, www.facebook.com/Starbucks).

Data is organized and structured primarily around these social media profiles. These analytic tools are great for quantitative insights, such as growth of fan base, engagement level between users and the branded profile, types of content posted by brands or fans, and types of post that drive engagement or sharing. If I'm Starbucks, is Peet's fan base more engaged than mine? Do they tend to post more pictures, videos, or comments on their Facebook page? There is no shortage of competitive comparisons one can do. Here are 2 fun analyses I previously wrote about using one of these tools: most engaging auto luxury brand and can Facebook stats predict Super Bowl winner.

All this data can easily be analyzed longitudinally across time to identify trends within a profile (e.g., how has things changed quarter over quarter?) or across various competitive profiles (e.g., is our engagement rate higher than our competitor?). The main outputs are trend charts, frequency distributions, and rates/ratios.

Popular paid tools include Quintly and Socialbakers. There really is no free option here as all the historical data is not really archived anywhere on the open web, not even Google.

All-in-Ones

There are tools that are now becoming more popular that claim to do all of the above on one platform, such as Sprinklr. Some might say these suffer from being a "jack of all trades, master of none." But it really boils down to your social media marketing level of sophistication and analytic prowess. For some clients, they don't need to go deep in all 3 areas and that's ok. Others enjoy drinking from the fire hose.

Summary

All 3 tools and capabilities are important for major brands. In my experience, I find most clients are using a premium product for the Customer and Company parts, but not so much the Competition piece.

I think it's largely a product category awareness issue. Many brands and agencies I work with simply don't know Social Media Profile Analytics tools are available and insightful. And because of the way the data is structured, you really can't use the social listening tools to analyze things at the social media profile level.

So whether you sign up for the stand alone Social Media Profile Analytics tools or some of these newer "all-in-one" suites, it's critical for brands to keep an eye on the competition. Otherwise, you've only got 2 legs on your 3-legged stool, which means you'll just fall flat on your face.

##

Disclosure: I am an advisor to Quintly

Saturday, January 31, 2015

Facebook Stats Predict Super Bowl XLIX Winner: PATRIOTS

With Super Bowl XLIX just around the corner, everyone is making predictions on who's going to win Sunday's big game. From using crystal balls to Kayak analyzing flight search volume data to Arizona, everybody has their own POV based on something or other.

As a data-driven digital strategist, I naturally turned to social media analytics. I looked at data from social media activity benchmarking company Quintly.

I compared the engagement on the Facebook profiles of the Super Bowl contenders from the past 3 years. I looked at the Interaction Rate from the Monday after the teams won the conference championship game to the Friday before the Super Bowl.

Quintly defines Interaction Rate as a combined index of the sum of Likes, Shares and Comments per a brand's own post, normalized by the total number of Fans:


The Facebook Interaction Rate of the last Friday has accurately predicted the winner of the last 2 Super Bowls. In Super Bowl 47, you can see the Ravens had a final surge of interaction and barely eeked out a win against the 49ers on Interaction Rate, as well as on the field, winning the Super Bowl, 34-31.

Ravens beat 49ers on Interaction on the last Friday and SB 47

Last year, the Interaction Rates of both teams were quite sporadic,with the Seahawks ahead by a large margin in the end. And in the big game, Seattle also beat Denver, 43-8.

Seahawks overtake Broncos

Looking at this year's data, while there's been lots of chatter about the Patriots the past week, most of it is over Deflate-Gate. So not really positive mojo. In fact, while Seattle's Interaction Rate doesn't change much, it appears the Patriots' sees a spike the last 2 days. This means the Patriots will likely win Super Bowl XLIX tomorrow.

Patriots Interaction Rate deflates but surges in the end

Enjoy the game, folks!


Disclosure: I am an advisor to Quintly.

##

Tuesday, December 16, 2014

Who is the Most Engaging Luxury Auto Brand on Facebook?

The auto industry is selling cars like hotcakes this year! The luxury segment is no exception. While BMW, Mercedes, Lexus, and Audi continue to duke it out in the dealerships for the crown of top selling luxury auto brand in the US, let's take a look at who's king in social media.

Using social media analytics tool Quintly, I set out to see how engaging each of these 4 auto makers were on Facebook.

First off, Audi has 9.5 million fans, more than double its closest competitor, Mercedes with 4.2 million. Lexus and BMW round out the pack with 3.5 million and 2.1 million, respectively. The 4 brands have been growing their fan base in a similar pattern this year, surprisingly all at about 1.5-2.0 million range.


What's interesting is despite posting on the lower end of the 4 brands (301), Audi saw about twice as many posts from its users than the other 3 brands (5,297). But there is more to this story.


The interaction rate (or I-Rate) provides an index of user likes, shares, and comments from a brand's post. Mercedes has the highest interaction rate (0.44%) and surprisingly Audi has the lowest by a wide margin (0.13%). Over the course of a year, Mercedes started strong and maintains a decent I-rate for rest of year albeit slightly lower. BMW is very erratic, while Lexus and Audi are relatively stable.


When analyzing the Interaction Rate by Post Type, Photos tend to generate the most engagement. That comes as no surprise to most social media marketers. What's amazing is how high the interaction rate is for status updates from Mercedes (as shown on the left below).


In the spirit of all the awards shows on TV this time of year, now let's turn to some of the categories for the Most Engaging Luxury Auto Brand Awards to understand what's behind these numbers.

Most Likes for a Post: Mercedes-Benz The #MBSummer post below had over 118K Likes. What made this wildly successful was how the same hashtag was spread across Twitter, Pinterest, Instagram, and Tumblr in a massive #MBSummer campaign, encouraging Mercedes enthusiasts to post photos of their cars. Great job on cross-channel marketing!

In fact, Mercedes owned the Top 5 Most Liked Posts in 2014. That helps explain its high interaction rate for 2014.


Most Comments for a Post: Lexus In April, Lexus generated over 2,500 Comments from fans when it turned to them to name the color of its new 450-hp RC F. This post also garnered over 13K Likes. And the winning color name was...Solar Flare.


Most Shared Post: Mercedes Last month, Mercedes' unveiling of the new Maybach 600 had over 7400 Shares. It also didn't do too shabby on other engagement metrics with 48K Likes and nearly 1600 Comments!


So who's the Most Engaging Luxury Auto Brand? Envelope please... I would have to say Mercedes is the most engaging luxury auto brand on Facebook this year. It's higher Interaction Rate (0.44%), highly driven by its engaging status updates, left the others in the dust!

All this goes to show what many socially savvy brands have already come to realize:
  • The number of fans doesn't mean as much these days
  • Getting organic reach and engagement is tough these days with all of Facebook's changes that drive brands toward paid placements. So it is truly impressive when a brand can drive high engagement rates still
  • Cross-channel integration, which is easier said than done sometimes, pays off


Disclosure: I am an advisor to Quintly.

##

Sunday, March 9, 2014

How Product Recalls Spread Through Social Media

February was a busy month for major product recalls.

Let's look at how the web and social media responded to 3 different companies in 3 different industries that announced major recalls. (A companion set of slides is also available on SlideShare.) The goal is to see if there were any similarities and differences based on how it was handled in those critical first 7 days.

General Motors 

GM announced on February 13th a major ignition switch recall, affecting 1.6 million vehicles. Many believe GM allegedly knew about the risks years ago and should have reported it sooner. A federal investigation is under way.


In the chart above, it is the number of mentions about the GM recall in the first week after the announcement.
As shown, GM instantly got lots of mentions in the mainstream media (under Other), such as Automotive News, USA Today, and Reuters. GM is an established global brand in a 100-year old auto industry that is heavily covered by traditional journalists. It was "front page" news in business publications, automotive publications, and those covering it from the angle of this being the first true test for the new female CEO Mary Barra.

Then news spread quickly on Facebook within 24 hours. Interestingly, Twitter had less conversations. But on Twitter, the top posters were still traditional news outlets like USAToday (with nearly 1 million followers) and @ReutersBiz.

Ironically, if you go to GM's Media site and look at February 12th (around the time of this recall), there is no mention of the ignition switch recall. Instead, there's a press release on how "GM Leads Automakers in Dependability Awards."

Even though @GMCustomerSvc responded to a few users on Twitter, GM was a bit slow to leverage social media to manage this PR crisis. @ChevyCustCare didn't really take to social media to address consumer concerns until nearly 2 weeks later when consumer backlash in social media risked long-term brand damage (a la Toyota's 2010 recall #FAIL). By then #gmrecall was trending quickly.

In a letter to employees, CEO Mary Barra defended GM and said it was a top priority for her to investigate this. Time will tell how this plays out.

Fitbit

Fitbit is a relatively young company that is the category leader in the nascent wearable tech industry. It's Fitbit Force is a wristband you wear that can track your activity. In January, customers were complaining on Fitbit's forums about skin rashes. Initially Fitbit attributed the issues to allergic reactions to nickel and said the device was tested by medical professionals. But consumer complaints piled up, Fitbit finally announced a product recall on February 20th with a blog post by CEO James Park. The Wall Street Journal was one of the first to break the news on mainstream media on February 21st. Then the floodgates burst open when the company's @FitbitSupport Twitter team started to responding to Twitter users. Word also spread, but to a lesser degree, on Facebook. (See below)


Fitbit got news out rapidly across all channels -- on its website and its social media channels instantly. That really helped calm the masses, as shown above.

FreeStyle / Omnipod

FreeStyle, from Abbott Diabetes Care, is a popular brand of blood glucose monitors for diabetes patients. Omnipod is an insulin management system made by Insulet. FreeStyle issued a product recall press release on February 19th on its corporate website about FreeStyle test strips leading to erroneous blood glucose readings when used with Omnipod.


As shown above, news spread rapidly in the first day on Facebook and Twitter via individuals and major diabetes organizations, such as JDRF. Discussions and lots of questions started developing by the first weekend in online forums, such as the American Diabetes Association's community.diabetes.org. A few influential bloggers, such as DiabetesMine and TheBloodSugarWhisperer, also posted the news early on.

By Monday, people were reporting in forums, Facebook, and Twitter of finally receiving letters in the mail and experiencing long wait times in the call center. This led to a second wave of online discussions as shown above.

Mainstream media was not as prominent in this case.

Conclusions

It's generally true that Facebook and Twitter is like gasoline on fire. And brands need to be ready to respond in those channels.

It is also interesting to see there isn't one common pattern for how news, such as major recalls, propagates online. It depends a lot on the industry, the brand's online presence (whether it has active social networks that are engaging with users in a customer support capacity), and an integrated online and offline communication strategy and execution.

When you look at a heavily watched and discussed industry like automotive, consumers (lots of people own, depend on, and love their cars), business people, and journalists all engage in conversations online.

Now look at a traditional regulated industry like medical devices. This industry tends to move slower in general, but it's even more cautious and slow to embrace social media. Heck, it wasn't until January of this year that the FDA finally released its draft guidelines for social media/UGC usage - 10 years after Facebook was founded by Mark Zuckerberg.

As Abbott Diabetes Care and Insulet learned, a few crucial days between the online press release and patient receiving mailed letters, coupled with a lack of a major presence in social networks, really fanned the flames online. Hjalte Hojsgaard, Insulet's manager of consumer marketing, sums up the issue quite well: “We would have liked to get the letter out even sooner, and get the word out on our website and social media, but these things sometimes take some time."

It was the opposite case with Fitbit, which is a company born in the Internet age. So it's not surprising that it had all the info consumers needed online when the recall was announced. It took full advantage of its robust social media presence that includes 13K @FitbitSupport Twitter followers to engage concerned customers. While GM has several decent-sized social media accounts, it waited too long to start engaging customers online, threatening to hurt the GM and Chevy brands.

Overall, Fitbit was the best of the 3 companies in managing the recall, once they "admitted" there was a problem.


##

Sunday, July 7, 2013

Twitter Jumps on Behavioral Targeting Bandwagon

On Wednesday, Twitter had a blog post about "Experimenting with new ways to tailor ads." They provided the following example:

Let’s say a local florist wants to advertise a Valentine’s Day special on Twitter. They’d prefer to show their ad to flower enthusiasts who frequent their website or subscribe to their newsletter. To get the special offer to those people who are also on Twitter, the shop may share with us a scrambled, unreadable email address (a hash) or browser-related information (a browser cookie ID). We can then match that information to accounts in order to show them a Promoted Tweet with the Valentine’s Day deal.

It is an interesting move by Twitter to engage in behavioral targeting, which is a proven tactic in online advertising. What we're seeing more of in the industry is what data is brought to bear to inform and improve re-targeting.

For example, site re-targeting was huge when it first came out. The idea of being able to serve a "hey, you, come on back and finish that order we know you were looking at on our site the other day" online ad to a cookied  user who had come to your site was fantastic! It still is.

As re-targeting grew, people got more creative with data, especially ways to tie various online data sets via cookies or other means. In Twitter's case, an email address or cookie would be tied to an advertiser's first-party data. I've also worked with brands that hand over their first-party CRM data (email addresses -- which are needed as the primary key to match to another data set -- and key segmentation variables) to a DMP/DSP that attempts to match user's cookies to re-target them across ad networks. In some cases, an intermediary like LiveRamp helps marry the data sets to facilitate this process.

The other targeting trend I am seeing that I think could show promise is 3rd-party data append of offline data to online behavioral data. For a long time, classic direct marketers have appended data from the likes of Experian or Acxiom with their CRM data to learn more about their customers' interests, financial profile, or shopping behavior. The challenge for a long time is with anonymous cookies, how do you tie that to a real person offline. Email was and still is a great primary key as consumers often use a specific legitimate email address for online shopping, signing up for newsletters or contests, etc. and usually keep that email address updated. That led to companies like Rapleaf whose main business is matching users via email addresses.

Then Facebook took it to a new level earlier this year when they announced a partnership with major 3rd-party marketing data companies, such as Epsilon, Acxiom, and Datalogix. Those names sound familiar? With their new self-serve Partner Categories ads, Facebook claimed it was a new way to target ads to more categories of people. For example, a local car dealership can now show ads to people who are likely in the market for a new car who live near their dealership. To date, advertisers have been able to show ads to people based on their expressed interests on Facebook. Now with Partner Categories, they can also show ads to people on Facebook based on the products and brands they buy online or offline. This has the potential to marry tried and true techniques of direct marketers with the power of the social graph!

And then there's FBX -- Facebook Exchange, which allows real-time bidding and behavioral targeting with data from third-party Web sites.

It's too early to tell if all this is working at Facebook. But in one early report of Partner Categories tests run by Facebook partner Social Code using a wonky KPI called "engagement per Like (EPL)" showed promise.

For a data-driven strategist like me, it's fun to get my hands dirty with first-party CRM data, 3rd-party data appends, and these social networks. What an exciting time in the industry!

##

Thursday, June 6, 2013

Yelp Helps Small Businesses Expand in More Ways Than One

As consumers, we all know how awesome and useful Yelp is, especially for things like restaurant reviews. It's invaluable when traveling to new cities and you're looking for a good bite to eat!

For a business, especially a small one, great reviews on Yelp definitely helps drive customer acquisition. That's a no brainer.

Recently I was talking to a friend who runs a successful wine bar that he started a few years ago. And he made me realize there is another important benefit of maintaining those strong positive reviews on Yelp as a small business looking to expand.

My friend is shopping for another location to grow his business, and he said that prospective landlords who may not know much about his business actually go on Yelp to learn more about it. It's an interesting use of Yelp -- helping landlords vet tenants!

Not only do great reviews help, but beautiful photos of the place of business (and not just food shots) do too. It gives the landlord a real sense of how nice and fancy schmancy the business is.

Speaking of photos, even Google Maps comes into play. Prospective landlords can not only see where your current location is, but also get a Street View of your business for its "curb appeal."

Come to think of it, lenders probably do the same thing...

##